Making Evaluations: Copy master 1 Lunchtime Places
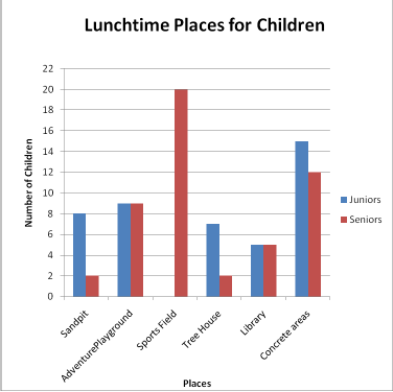
“The teachers at Sunshine school wanted to know where the most children play at lunchtime. After one lunchtime they asked all the children where they had spent most of the lunchtime and made a bar graph.
Lunchtimes places for children!
How many children was involved in the survey:
- Sandpit- Juniors: 8 Seniors: 2 8+2=10
- Playground- Juniors: 9 Seniors: 9 9+9=18
- Sports field- Juniors: 0 Seniors: 20 0+20=20
- Tree house- Juniors: 5 Seniors: 2 5+2=7
- Library- Juniors: 7 Seniors: 5 7+7=14
- Concrete areas: Juniors: 15 Seniors 12 15+ 12= 27
After analysing the data above, I have found out that there were 44 Juniors and 50 Seniors in different lunch time places around the school. A total of 94 children.
Juniors:8+9+0+7+5+15=44
Seniors: 2+9+20+2+5+12=50
Total number of children 50 + 44 = 94
W.A.L.T- Analyse and discuss data displays.
No comments:
Post a Comment
Note: only a member of this blog may post a comment.